The CBOE VIX Fear Index
Overview
The Volatility Index, or VIX, is a real-time market index representing the market's expectations for volatility over the coming 30 days. Often referred to as the "fear gauge," the VIX is calculated by the Chicago Board Options Exchange (CBOE) and represents a measure of market risk and investor sentiment.
The VIX is currently 12.92, which is approximately 34% (or about 0.8 standard deviations) below its historical average of 19.53, suggesting that stock market sentiment is Neutral.
This is shown in the chart below, followed by more data on the history and methodology of this model.
What is the VIX?
The VIX is a mathematical measure of expected stock market volatility. When the VIX is high, it means that investors expect significant price changes (either up or down) in the S&P 500 over the next month. On the other hand, when the VIX is low, it indicates that investors anticipate price stability. Since inception in 1993, the VIX average value has been 19.53% with a standard deviation of 7.9%.
As a mathematical idea, the VIX was originally conceived in an academic paper published in the Financial Analysts Journal, August 1989; "New Financial Instruments for Hedging Changes in Volatility", by Menachem Brenner and Dan Galai. Their idea was to establish an underlying asset for stock market futures and options that could provide a benchmark for market expectations regarding future volatility. This would allow market participants to trade (and protect against) volatility just like other market derivatives. Based on this work, the Chicago Board Options Exchange (CBOE) launched the VIX in 1993.
How is the VIX Calculated?
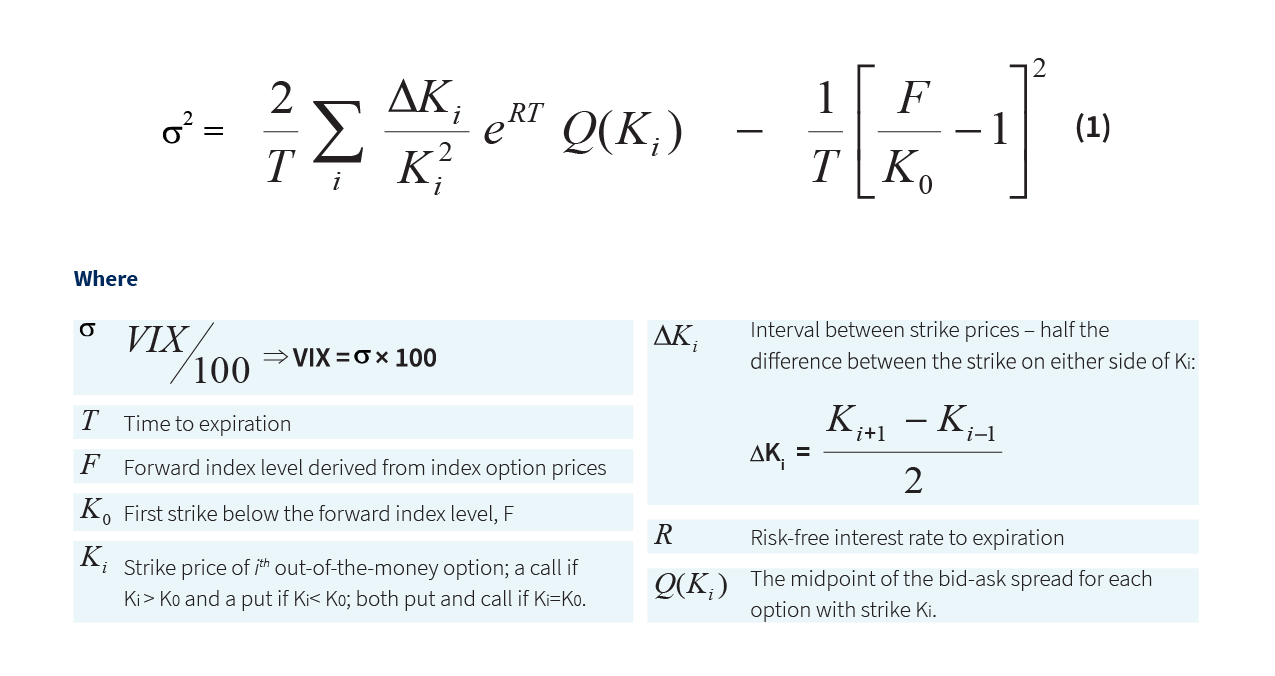
The actual methodology used to calculate the VIX requires some pretty intense math; this is the financial theory that drives options pricing. The CBOE defines the VIX calculation using the handy image below:

What this boils down to is that by using the available price information from 23-37 day out-of-the-money SPX options, we can calculate expected volatility. This result is a 1 standard deviation range of expected volatility over the next 30 days, expressed as an annualized percentage. If the VIX is 50, that means that SPX options prices imply that the market expects the S&P500 to move either up or down 50% (on an annualized basis) over the next 30 days.
Interpreting the VIX
The most important thing to understand about the VIX is that it makes no claim on directionality. That is, the VIX does not predict if the stock market will go up or down. The VIX is only a measure of the expected magnitude of future stock market changes. In this sense, the VIX is not a traditional bullish/bearish indicator. Mathematically, a high VIX is not a claim that investors are worried that the stock market is too high, only that investors are worried that the stock market will make large swings in the near future. In practice, however, big swings in the market tend to be crashes, and so the VIX is often referred to as the 'fear index', since high values indicate fear of upcoming volatility and crash potential. (And, indeed, the VIX does tend to move inversely with the S&P500, with large spikes up in VIX correlating with sharp declines in the stock market).
The VIX is currently at 12.92. This means that in the next 30 days, investors are expecting the US stock market to go either up or down by 1.02% (12.92% on an annualized basis). Since VIX is a measure of one standard deviation, you could rephrase this to say that in aggregate investors are 68% sure that in the next 30 days the market range will be +/- 1.02%, and 98% sure that it will be +/- 2.04%.
We can illustrate this confidence range against the current S&P500, below:
Additional Resources
The below explainer video produced by the CBOE is a handy summary: