Mean Reversion
Overview
As of November 30, 2023, the S&P500 is currently trading 46% above its modern-era historical trend value, (about 1.3 standard deviations), indicating that the market is Overvalued.
Why it Matters
This is a basic model based on a fitted exponential growth rate for the S&P500. To continuously stay above the trend line suggests that the stock market must continue to grow at a continuously higher growth rate. Such explosive growth is not sustainable over long periods.
Theory & Data

Mean Reversion
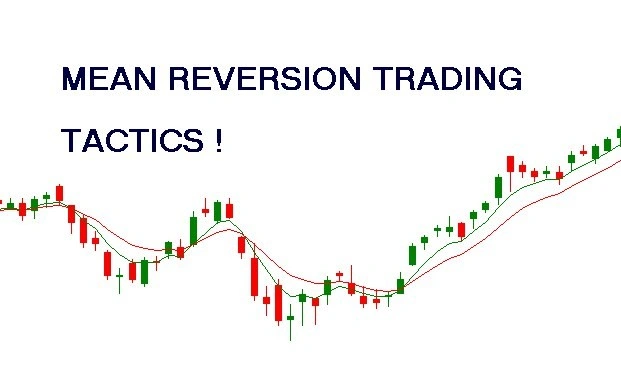
Mean reversion, or the basic principal that what goes up must come down, is a commonly held belief among market participants. Short-term movements of the stock market can be chaotic and unpredictable; however, over the long run, the trend of stock market returns has been upwards in a rather predictable manner. These deviations can also be extended to decades. Thus, mean reversion is not an effective strategy for short-term trading but a useful indicator of the overall valuation of the markets in relation to their historical trends.
S&P500
We work with daily closing prices for the S&P 500, which have been available on Yahoo Finance since 1950. To account for inflation, we adjust these figures to current dollar values using CPI data from the US Bureau of Labor Statistics. While other broad market indices, such as the Russell 2000 or Wilshire 5000, would produce similar outcomes, the S&P 500 is more accessible and widely recognized by most investors. Below, you’ll see the data presented alongside an exponential regression line that highlights its long-term trend.
Current Values & Analysis
Exponential Growth
The S&P chart provides a clear view of the past 70 years of economic growth. The exponential regression line illustrates the roughly 10% annual returns that have become a hallmark of modern investing. Notable deviations from this trend include the prolonged bear market of the 1970s and early 1980s, the dramatic rise and fall of the internet bubble in the late 1990s, and the Great Recession in 2008. Since the recovery began in 2009, we've experienced an unprecedented bull market in both duration and scale. Even with the market corrections seen in 2022, the index remains significantly above its historical trend line.
It’s important to use an exponential growth trend line in this case, rather than a traditional mean, to accurately reflect the dramatic productivity gains in the market over time. Since 1950, the composition of the stock market has evolved significantly, with high-tech companies leading the charge in innovation and productivity. By using an exponential regression, we capture this parabolic growth and incorporate it into our future expectations, providing a more realistic view of long-term market trends.
De-trending the Data
We can see that the S&P500 is currently priced above the trend line, but it isn't intuitive or obvious how far away we are from the trend relative to prior peaks.
This time, we'll display the data with the historical trend line as a straight line along the x-axis, while the S&P 500 is plotted on the y-axis as a percentage above or below the trend value. It's important to note that the trend line in this chart is the same exponential line from the previous chart; however, it’s presented as a straight line here to make comparing it to the actual S&P 500 easier. Instead of showing the S&P 500's actual dollar values, we’ll express it as a percentage relative to the trend line—highlighting how far the market is above or below its expected growth path.
Standard Deviations
Finally, we'll display the same chart, but this time we'll adjust the y-axis to show the number of standard deviations the S&P 500 is from the trend line. This approach aligns with our ratings and other models, offering a more intuitive way to assess how extreme the peaks and valleys are in terms of market valuation. By using standard deviations, we can better understand the relative "extremes" of market performance, providing a clearer perspective on how far the market is deviating from its long-term trend.
Results
The de-trended data reveals that the S&P 500 is currently 2.0 standard deviations above its historical trend line, indicating that the market is strongly overvalued at this point. This significant deviation suggests that the current market level is much higher than what would be expected based on its long-term growth trend.